
Popular Post
-
 I have got the comment on my previous post “ BIRT based Control Chart “ with questions about how actually in BIRT the data are prepared for ...
 -
Your are welcome to post to this blog any message related to the Capacity, Performance and/or Availability of computer systems. Just put you...
Monday, December 17, 2012
IT Specialist Certification for Actualizing IT Solutions
I have finally got certified:

 He started in 1979 as IBM/370 system engineer. In 1986 he got his PhD. in Robotics at St. Petersburg Technical University (Russia) and then worked as a professor teaching CAD/CAM, Robotics for 12 years. He published 30+ papers and made several presentations for conferences related to the Robotics and Artificial Intelligent fields. In 1999 he moved to the US, worked at Capital One bank as a Capacity Planner. His first CMG.org paper was written and presented in 2001. The next one, "Exception Detection System Based on MASF Technique," won a Best Paper award at CMG'02 and was presented at UKCMG'03 in Oxford, England. He made other tech. presentations at IBM z/Series Expo, SPEC.org, Southern and Central Europe CMG and ran several workshops covering his original method of Anomaly and Change Point Detection (Perfomalist.com). Author of “Performance Anomaly Detection” class (at CMG.com). Worked 2 years as the Capacity team lead for IBM, worked for SunTrust Bank for 3 years and then at IBM for 3 years as Sr. IT Architect. Now he works for Capital One bank as IT Manager at the Cloud Engineering and since 2015 he is a member of CMG.org Board of Directors. Runs UT channel iTrubin
IT Capacity Council related CMG papers
- R. Kephart The Job You Save
- Linwood Merritt: 1. Seeing the Forest AND the Trees: Capacity Planning for a Large Number of Servers (CMG Paper)
- Igor Trubin (me)
He started in 1979 as IBM/370 system engineer. In 1986 he got his PhD. in Robotics at St. Petersburg Technical University (Russia) and then worked as a professor teaching CAD/CAM, Robotics for 12 years. He published 30+ papers and made several presentations for conferences related to the Robotics and Artificial Intelligent fields. In 1999 he moved to the US, worked at Capital One bank as a Capacity Planner. His first CMG.org paper was written and presented in 2001. The next one, "Exception Detection System Based on MASF Technique," won a Best Paper award at CMG'02 and was presented at UKCMG'03 in Oxford, England. He made other tech. presentations at IBM z/Series Expo, SPEC.org, Southern and Central Europe CMG and ran several workshops covering his original method of Anomaly and Change Point Detection (Perfomalist.com). Author of “Performance Anomaly Detection” class (at CMG.com). Worked 2 years as the Capacity team lead for IBM, worked for SunTrust Bank for 3 years and then at IBM for 3 years as Sr. IT Architect. Now he works for Capital One bank as IT Manager at the Cloud Engineering and since 2015 he is a member of CMG.org Board of Directors. Runs UT channel iTrubin
Tuesday, November 20, 2012
SETDS Methodology
2022 UPDATE
Some of the SETDS features are implemented into www.Perfomalist.com tool, which is described in the following post: https://www.trutechdev.com/2021/12/ and last release notes are HERE . The detailed Perfomalist CPD method is explained in this blog: https://www.trub.in/2020/08/cpd-change-points-detection-is-planed.html
_________________________________________________________________________________
Preparing my upcoming CMG'12 presentation about SEDS-lite I try to formulate what SEDS or extended version of that - SETDS actually is.
SE(T)DS is Statistical Exception (and Trend) Detection System. It is not an application. But could be implemented by developing one. And I have done that several times (using SAS, COGNOS, BIRT, R and other programming/reporting systems). But developing SETDS-like reports/apps is just a beginning. The most important part of SETDS is how to use that for Systems Capacity Management and how to build that in the Service Management processes. The set of my CMG papers I wrote since 2001 (list is in the very 1st post of this blog) describes that in details.
By the way it is not absolutely necessary to develop the SETDS application because starting from BMC PP and visualizer (now it is Capacity Optimizer, Perceiver and Proactive Net) a lot of performance tools have SETDS-like features and this blog has several posts analyzing them (e.g. see Gartner's Magic Quadrant).
A Capacity Manager just need to know how to use the home made or vendor based SETDS-like tools features efficiently and SETDS is the method.
So bottom line is:
SETDS is the methodology of using statistical filtering, pattern recognition, active base-lining, dynamic vs. static thresholds, IT-Control Charts, Exception Value (EV) based reporting/smart alerting and EV based change points/trends detection to do Systems Capacity Management including Capacity Planning and Performance Engineering.
What value SETDS could bring to a company? I will formulate that later during and after my CMG'12 presentations on which you are welcome to attend (www.CMG.org)!
(2018 UPDATE: Note , SEDS is the unsupervised SPC/MASF ML based Anomaly Detection method)
CPD perfomalist example:
 He started in 1979 as IBM/370 system engineer. In 1986 he got his PhD. in Robotics at St. Petersburg Technical University (Russia) and then worked as a professor teaching CAD/CAM, Robotics for 12 years. He published 30+ papers and made several presentations for conferences related to the Robotics and Artificial Intelligent fields. In 1999 he moved to the US, worked at Capital One bank as a Capacity Planner. His first CMG.org paper was written and presented in 2001. The next one, "Exception Detection System Based on MASF Technique," won a Best Paper award at CMG'02 and was presented at UKCMG'03 in Oxford, England. He made other tech. presentations at IBM z/Series Expo, SPEC.org, Southern and Central Europe CMG and ran several workshops covering his original method of Anomaly and Change Point Detection (Perfomalist.com). Author of “Performance Anomaly Detection” class (at CMG.com). Worked 2 years as the Capacity team lead for IBM, worked for SunTrust Bank for 3 years and then at IBM for 3 years as Sr. IT Architect. Now he works for Capital One bank as IT Manager at the Cloud Engineering and since 2015 he is a member of CMG.org Board of Directors. Runs UT channel iTrubin
Wednesday, November 14, 2012
SAS code to build Control Chart
As I have already shared at the "The Master of MASF" post there was the CMG presentation (where BTW my work and this blog were mentioned) that illustrates how to use SAS to build MASF Control Charts.
The two parts of that presentation are available at the www.MXG.com along with link to SAS code that could be used to build control charts:
The two parts of that presentation are available at the www.MXG.com along with link to SAS code that could be used to build control charts:
| Automatic Daily Monitoring of Continuous Processes
Theory and Practice Frank Bereznay and MP Welch (UKCMG2011) (SWCMG2011) |
||
| Filename | Size (bytes) | Date Posted |
| ADMCP Part 1 PDF | 1,178 KB | May 17, 2011 |
| ADMCP Part 2 PDF | 8,719 KB | May 17, 2011 |
| Coding Sample admcp_sample.sas | 4KB | May 17, 2011 |
| HTMLBLUE SG 9.3 Style Preview (Make 9.2 look like 9.3) | 31KB | May 17, 2011 |
He started in 1979 as IBM/370 system engineer. In 1986 he got his PhD. in Robotics at St. Petersburg Technical University (Russia) and then worked as a professor teaching CAD/CAM, Robotics for 12 years. He published 30+ papers and made several presentations for conferences related to the Robotics and Artificial Intelligent fields. In 1999 he moved to the US, worked at Capital One bank as a Capacity Planner. His first CMG.org paper was written and presented in 2001. The next one, "Exception Detection System Based on MASF Technique," won a Best Paper award at CMG'02 and was presented at UKCMG'03 in Oxford, England. He made other tech. presentations at IBM z/Series Expo, SPEC.org, Southern and Central Europe CMG and ran several workshops covering his original method of Anomaly and Change Point Detection (Perfomalist.com). Author of “Performance Anomaly Detection” class (at CMG.com). Worked 2 years as the Capacity team lead for IBM, worked for SunTrust Bank for 3 years and then at IBM for 3 years as Sr. IT Architect. Now he works for Capital One bank as IT Manager at the Cloud Engineering and since 2015 he is a member of CMG.org Board of Directors. Runs UT channel iTrubin
Wednesday, October 24, 2012
Not a MASF Based Statistical Techniques (Entropy-based) for Anomaly Detection in Data Centers (and Clouds)
The following papers published on Mendeley criticizes the MASF Gaussian
assumption and offer other methods (Tukey and
Relative Entropy) to detect anomalies statistically. (BTW I tried to use the entropy analysis to capture performance anomalies - check my other post)
1. Statistical techniques for online anomaly detection in data centers
by , , , , ,
Abstract

2. Online detection of utility cloud anomalies using metric distributions
1. Statistical techniques for online anomaly detection in data centers
by , , , , ,
Abstract
Online anomaly detection is an important step in
data center management, requiring light-weight techniques that provide
sufficient accuracy for subsequent diagnosis and management actions.
This paper presents statistical techniques based on the Tukey and
Relative Entropy statistics, and applies them to data collected from a
production environment and to data captured from a testbed for
multi-tier web applications running on server class machines. The
proposed techniques are lightweight and improve over standard Gaussian
assumptions in terms of performance.

2. Online detection of utility cloud anomalies using metric distributions
He started in 1979 as IBM/370 system engineer. In 1986 he got his PhD. in Robotics at St. Petersburg Technical University (Russia) and then worked as a professor teaching CAD/CAM, Robotics for 12 years. He published 30+ papers and made several presentations for conferences related to the Robotics and Artificial Intelligent fields. In 1999 he moved to the US, worked at Capital One bank as a Capacity Planner. His first CMG.org paper was written and presented in 2001. The next one, "Exception Detection System Based on MASF Technique," won a Best Paper award at CMG'02 and was presented at UKCMG'03 in Oxford, England. He made other tech. presentations at IBM z/Series Expo, SPEC.org, Southern and Central Europe CMG and ran several workshops covering his original method of Anomaly and Change Point Detection (Perfomalist.com). Author of “Performance Anomaly Detection” class (at CMG.com). Worked 2 years as the Capacity team lead for IBM, worked for SunTrust Bank for 3 years and then at IBM for 3 years as Sr. IT Architect. Now he works for Capital One bank as IT Manager at the Cloud Engineering and since 2015 he is a member of CMG.org Board of Directors. Runs UT channel iTrubin
Tuesday, October 23, 2012
MASF Control Charts Against DB2 Performance Data
I have done that before... I used for that my own variation of MASF Control Chart called "IT- Control Chart". You can see the example in my older post: Power of Control Charts and IT-Chart Concept (Part 1) :
 But not only me do that! I have found the following paper in MeasureIt :
Capacity Planning has an Important Role in Assisting Senior IT Management April, 2007, writen by Rick Isom.
The paper has a good MASF reference, the list of DB2 performance metrics that are good to be analyzed by MASF Control Charts and a few examples of Control Charts in form of 24-hour profile. One example is below (Linked to picture form the original paper published on Internet):
 He started in 1979 as IBM/370 system engineer. In 1986 he got his PhD. in Robotics at St. Petersburg Technical University (Russia) and then worked as a professor teaching CAD/CAM, Robotics for 12 years. He published 30+ papers and made several presentations for conferences related to the Robotics and Artificial Intelligent fields. In 1999 he moved to the US, worked at Capital One bank as a Capacity Planner. His first CMG.org paper was written and presented in 2001. The next one, "Exception Detection System Based on MASF Technique," won a Best Paper award at CMG'02 and was presented at UKCMG'03 in Oxford, England. He made other tech. presentations at IBM z/Series Expo, SPEC.org, Southern and Central Europe CMG and ran several workshops covering his original method of Anomaly and Change Point Detection (Perfomalist.com). Author of “Performance Anomaly Detection” class (at CMG.com). Worked 2 years as the Capacity team lead for IBM, worked for SunTrust Bank for 3 years and then at IBM for 3 years as Sr. IT Architect. Now he works for Capital One bank as IT Manager at the Cloud Engineering and since 2015 he is a member of CMG.org Board of Directors. Runs UT channel iTrubin
Saturday, October 20, 2012
Theory of Anomaly Detection: Stanford University Video Lectures
That is the part of Machine Learning Lectures: https://class.coursera.org/ml/lecture/preview/index.
XV. Anomaly Detection (Week 9)
- Problem Motivation (8 min)
- Gaussian Distribution (10 min)
- Algorithm (12 min)
- Developing and Evaluating an Anomaly Detection System (13 min)
- Anomaly Detection vs. Supervised Learning (8 min)
- Choosing What Features to Use (12 min)
- Multivariate Gaussian Distribution (Optional) (14 min)
He started in 1979 as IBM/370 system engineer. In 1986 he got his PhD. in Robotics at St. Petersburg Technical University (Russia) and then worked as a professor teaching CAD/CAM, Robotics for 12 years. He published 30+ papers and made several presentations for conferences related to the Robotics and Artificial Intelligent fields. In 1999 he moved to the US, worked at Capital One bank as a Capacity Planner. His first CMG.org paper was written and presented in 2001. The next one, "Exception Detection System Based on MASF Technique," won a Best Paper award at CMG'02 and was presented at UKCMG'03 in Oxford, England. He made other tech. presentations at IBM z/Series Expo, SPEC.org, Southern and Central Europe CMG and ran several workshops covering his original method of Anomaly and Change Point Detection (Perfomalist.com). Author of “Performance Anomaly Detection” class (at CMG.com). Worked 2 years as the Capacity team lead for IBM, worked for SunTrust Bank for 3 years and then at IBM for 3 years as Sr. IT Architect. Now he works for Capital One bank as IT Manager at the Cloud Engineering and since 2015 he is a member of CMG.org Board of Directors. Runs UT channel iTrubin
Tuesday, October 16, 2012
Availability vs. Capacity
Continuing the previous posts about "Battle between "Gut-feeling" and Engineering." ....
Engineer 2: Igor - if you would like to find further extensions of your equation, you might check out Volume 1 of "Breaking the Availability Barrier," which I co-authored and which is available on Amazon. Also, check out several papers I published in the Availability Digest in the Geek Corner (http://www.availabilitydigest.com/articles.htm). A subscription is free.

Engineer 2: Igor - if you would like to find further extensions of your equation, you might check out Volume 1 of "Breaking the Availability Barrier," which I co-authored and which is available on Amazon. Also, check out several papers I published in the Availability Digest in the Geek Corner (http://www.availabilitydigest.com/articles.htm). A subscription is free.
Igor Trubin: Yes, I have already looked briefly at your
book and referenced it in my blog, Very good book and I plan to read
that all.
UPDATE: After reading one of suggested above papers ( "Calculating
Availability - Redundant Systems"
Some useful
rules come out of the derivation of the availability equation.) I was able to show to my client that the following more general cluster (system) availability formula proves that for three-node cluster (n=3) the one spare node (s=1) configuration could provide approximately the same cluster availability as in the case of two spare nodes (s=2) but Capacity usage could be a critical factor as seen below.
That could be a way to save money by allocating less capacity with the same number but more reliable nodes.
He started in 1979 as IBM/370 system engineer. In 1986 he got his PhD. in Robotics at St. Petersburg Technical University (Russia) and then worked as a professor teaching CAD/CAM, Robotics for 12 years. He published 30+ papers and made several presentations for conferences related to the Robotics and Artificial Intelligent fields. In 1999 he moved to the US, worked at Capital One bank as a Capacity Planner. His first CMG.org paper was written and presented in 2001. The next one, "Exception Detection System Based on MASF Technique," won a Best Paper award at CMG'02 and was presented at UKCMG'03 in Oxford, England. He made other tech. presentations at IBM z/Series Expo, SPEC.org, Southern and Central Europe CMG and ran several workshops covering his original method of Anomaly and Change Point Detection (Perfomalist.com). Author of “Performance Anomaly Detection” class (at CMG.com). Worked 2 years as the Capacity team lead for IBM, worked for SunTrust Bank for 3 years and then at IBM for 3 years as Sr. IT Architect. Now he works for Capital One bank as IT Manager at the Cloud Engineering and since 2015 he is a member of CMG.org Board of Directors. Runs UT channel iTrubin
Monday, October 8, 2012
Systems Availability Arena: Battle between "Gut-feeling" and Engineering. Round 3. (2 and 3 are in the previous posts)
UPDATE: the start is here
UPDATE: other rounds are here
"Gut-feeler 1" • A comment on the math for availability calculations: Certainly not being a math hero, I can still understand that playing with formulas can be much fun. But we ought to take care whether the results generated by these formulas are actually producing value in real world situations.
Misleadig fomulas can be dangerous and ought to be kept in a pen and paper / chalk and blackboard environment. When those formulas can be "googled", there is the risk that some younger and less experienced person working in the role of an IT architect takes them at face value and bases real world decisons on those - or even worse, someone might write a related Wikipedia article and multiplies the damage ...
Igor's initial formula suggests that any four node cluster is hundred times more reliable than a two node cluster, and that any cluster can easily achieve 99,999% availability if you only add enough nodes. Bill's revised formula would suggest an even stronger growth in availability when adding cluster nodes ...
"Engineer 2" has already pointed out that these are moot calculations, as the formulas are just not applicable in those real world environments we are talking about. You would not construct a large building or a bridge using elegant formulas that produce over-optimistic results which are in stark contrast with real world experience. Everybody knows that after the collapse, the architect would go to jail ...
IT architects do also carry responsibility - it might be somewhat limited when desining a webshop for selling cosmetics or toys, when only the shopowner would be disappointed after investing in additional nodes and not getting the expected reliability in return. But for instance, when building 911 emergency communication systems controlling police, ambulance and fire brigade services, lives are at stake and could be lost due to system outages. Here, only the most reliable IT infrastructure is good enough - and creating false expectations by misleading formulas would be fatal.
"Engineer 3": "In Theory, there is no difference between Theory and Practice. In Practice, there is" I don't know where I found the quote above but I like it. Nevertheless, I think one should in fact do both for any system of significant importance:
(1) Use Math, a.k.a."Theory" to calculate the expected availability and adjust as needed to match the required availability. Ignoring Math/Theory and replacing it with only gut feeling and/or trust in vendor statements does not sound right to me. (2) Apply gut feeling; maybe better called experience or " Practice"; Combine the two and you are off to a good start IMHO...
He started in 1979 as IBM/370 system engineer. In 1986 he got his PhD. in Robotics at St. Petersburg Technical University (Russia) and then worked as a professor teaching CAD/CAM, Robotics for 12 years. He published 30+ papers and made several presentations for conferences related to the Robotics and Artificial Intelligent fields. In 1999 he moved to the US, worked at Capital One bank as a Capacity Planner. His first CMG.org paper was written and presented in 2001. The next one, "Exception Detection System Based on MASF Technique," won a Best Paper award at CMG'02 and was presented at UKCMG'03 in Oxford, England. He made other tech. presentations at IBM z/Series Expo, SPEC.org, Southern and Central Europe CMG and ran several workshops covering his original method of Anomaly and Change Point Detection (Perfomalist.com). Author of “Performance Anomaly Detection” class (at CMG.com). Worked 2 years as the Capacity team lead for IBM, worked for SunTrust Bank for 3 years and then at IBM for 3 years as Sr. IT Architect. Now he works for Capital One bank as IT Manager at the Cloud Engineering and since 2015 he is a member of CMG.org Board of Directors. Runs UT channel iTrubin
Wednesday, October 3, 2012
Systems Availability Arena: Battle between "Gut-feeling" and Engineering. Round 2.
This is continuation of the previous post.
Gut-feeler 1 • Gut feelings aren't always bad - for instance, when working on an IT project meant to support really critical business processes, and hence with a lot of money or even lives at stake, your gut feeling might be that standard clustering just isn't good enough and you need something significantly better here.
Then it comes to curiosity - is there something better around than the usual standard clustering ? Is there some other IT infrastructure, one that is fault tolerant and self-healing, providing much more reliability right out of the box than you could ever achieve using the plain vanilla stuff and the most sophisticated clustering conceiveable ?
If being that curious, chances are you will end up at NonStop.
Not being curious and just doing calculations, you just might end up with adding more nodes to your standard cluster hoping to make it more reliable - which in the real world often turns out to be a false hope ...
But don't get me wrong, I'm not at all against calculations. A very important one is on capacity, will (n - 1) nodes still support my workload, when a node went down for whatever reason ? That's often overlooked ...
Engineer 2 Two comments, one on the Trubin law, and one on .. comments [above]. .... Adding a node of m 9s to a node of m9s adds m9s to a cluster. The overall availability of a cluster of n nodes, each with m 9s availability, is mn 9s.... For instance, a three-node cluster of nodes with 2 9s availability will be six nines...
Let f = the failure probability of a node [A=(1-f)]. If f is an even number of nines, then the failure probability of a node is f= 0.1^m, where m is the number of nines (for instance, for three nines, f=0.1^3 =.001 and A =(1-0.1^3) = 0.999). For an n-node cluster, its availability is 1-(1-A)^n = 1-[1-(1-0.1^m)^n = 1-(0.1^m)n = 1-0.1^mn.
In general, if a node has a failure probability of f, then an n-node cluster has an availability of 1-f^mn. Two nodes with availabilities of 0.95 will have an availability of 0.9975.
Of course, this assumes that the cluster fails only if all nodes fail. Generally, a cluster can withstand the failure of some nodes but not all. In this case, the above relations can be modified to accommodate this situation.
"Gut-feeler 1"'s suggestion that adding nodes does not result in this additional availability is quite correct. The above relations apply only to hardware failures (or whatever failures might be included in the nodal availability), and are accurate for those. However, once the hardware availability becomes high (say four 9s), other factors that are not node related come into play, such as software bugs, operator errors, and environmental faults (power, air conditioning). These limit the practical availability that can be achieved. In effect, after a certain point, increases in hardware availability become irrelevant to system availability.
Thanks for starting a very interesting and meaningful thread, Igor.
See the next post for the next round.
He started in 1979 as IBM/370 system engineer. In 1986 he got his PhD. in Robotics at St. Petersburg Technical University (Russia) and then worked as a professor teaching CAD/CAM, Robotics for 12 years. He published 30+ papers and made several presentations for conferences related to the Robotics and Artificial Intelligent fields. In 1999 he moved to the US, worked at Capital One bank as a Capacity Planner. His first CMG.org paper was written and presented in 2001. The next one, "Exception Detection System Based on MASF Technique," won a Best Paper award at CMG'02 and was presented at UKCMG'03 in Oxford, England. He made other tech. presentations at IBM z/Series Expo, SPEC.org, Southern and Central Europe CMG and ran several workshops covering his original method of Anomaly and Change Point Detection (Perfomalist.com). Author of “Performance Anomaly Detection” class (at CMG.com). Worked 2 years as the Capacity team lead for IBM, worked for SunTrust Bank for 3 years and then at IBM for 3 years as Sr. IT Architect. Now he works for Capital One bank as IT Manager at the Cloud Engineering and since 2015 he is a member of CMG.org Board of Directors. Runs UT channel iTrubin
Tuesday, October 2, 2012
Systems Availability Arena: Battle between "Gut-feeling" and Engineering!
I have put my Cluster Availability 9's Equation post to LinkedIn Continuous Availability forum and got 19 comments, divided in about two camps: "Gut-feelers" and "Engineers". Below is the first two comments. (See next posts for other comments.)


Gut-feeler 1: "Nice formula, looks good in theory – but won’t hold true in the real world. The reason for this is the underlying assumption of an ideal cluster, which does not exist in the real world. When looking at some real world implementation like the Oracle RAC cluster, you will find that a simple two-node cluster configuration will typically deliver somewhere between three and four nines of availability.
Now, will adding a third node to that cluster add another 9 to the availability figure ? Will a ten node cluster really provide 99.999999999999 % availability ? Will a cluster with hundred nodes run continuously for thousands of years without any outage ?
Certainly not, and talking to system administrators running typical cluster installations will quickly reveal that large clusters are quite complex and difficult to handle, hence more prone to failure than simple two-node clusters.
Even when looking at the HP NonStop architecture – which comes pretty close to the ideal cluster – the formula would not apply. A NonStop system (which internally is indeed a cluster, each NonStop CPU resembling a node) delivers roughly five nines of availability – but there is no significant availability difference between systems eg. with four and with sixteen CPU’s (cluster nodes).
So it is not so important how many nodes you have – but it is very important what kind of cluster you have !
Engineer 1 • I know this particular formula is too simple for the real world, so I completely agree with your comment. But still the complexity of big clusters can be modeled by more complex math. models by e.g. adding more boxes with parallel and series type of connections. And the formula will be much more ugly but useful I believe... Plus each individual node could be decomposed on some structure to model both HW and SW parts. The approach is written in some books I mentioned in my other posts, and it is suppose to be a tool to do that, but I am not aware of any. Are you?
In my real life this type of calculation/modeling is just a starting point to get rough estimation and then using some monitoring data to get that adjusted. What I do not like is when some Architects makes some decisions of the level of cluster redundancy without ANY calculation (!), just based on their gut feelings....
In my real life this type of calculation/modeling is just a starting point to get rough estimation and then using some monitoring data to get that adjusted. What I do not like is when some Architects makes some decisions of the level of cluster redundancy without ANY calculation (!), just based on their gut feelings....
He started in 1979 as IBM/370 system engineer. In 1986 he got his PhD. in Robotics at St. Petersburg Technical University (Russia) and then worked as a professor teaching CAD/CAM, Robotics for 12 years. He published 30+ papers and made several presentations for conferences related to the Robotics and Artificial Intelligent fields. In 1999 he moved to the US, worked at Capital One bank as a Capacity Planner. His first CMG.org paper was written and presented in 2001. The next one, "Exception Detection System Based on MASF Technique," won a Best Paper award at CMG'02 and was presented at UKCMG'03 in Oxford, England. He made other tech. presentations at IBM z/Series Expo, SPEC.org, Southern and Central Europe CMG and ran several workshops covering his original method of Anomaly and Change Point Detection (Perfomalist.com). Author of “Performance Anomaly Detection” class (at CMG.com). Worked 2 years as the Capacity team lead for IBM, worked for SunTrust Bank for 3 years and then at IBM for 3 years as Sr. IT Architect. Now he works for Capital One bank as IT Manager at the Cloud Engineering and since 2015 he is a member of CMG.org Board of Directors. Runs UT channel iTrubin
Tuesday, September 25, 2012
Wavelets and Anomaly Detection - another CMG'12 paper
In the CMG'12 conference agenda I see another interesting paper appeared and it is written by Dima Seliverstov who I have met before in another CMG conference and mentioned in this blog .
His paper is called
"Introduction to Wavelets and their Application for Computer Performance Trend and
Anomaly Detection"
The very short abstract is
"In this session, I will present a technique to identify trends and anomalies in Performance data using wavelets. I will answer the following questions: Why use Wavelets? What are Wavelets? How do I use them?"
CMG'12 conference Monday: 2:45 pm ‐ 3:45 pm Subject Area: Capacity Planning
I plan to attend. You?
He started in 1979 as IBM/370 system engineer. In 1986 he got his PhD. in Robotics at St. Petersburg Technical University (Russia) and then worked as a professor teaching CAD/CAM, Robotics for 12 years. He published 30+ papers and made several presentations for conferences related to the Robotics and Artificial Intelligent fields. In 1999 he moved to the US, worked at Capital One bank as a Capacity Planner. His first CMG.org paper was written and presented in 2001. The next one, "Exception Detection System Based on MASF Technique," won a Best Paper award at CMG'02 and was presented at UKCMG'03 in Oxford, England. He made other tech. presentations at IBM z/Series Expo, SPEC.org, Southern and Central Europe CMG and ran several workshops covering his original method of Anomaly and Change Point Detection (Perfomalist.com). Author of “Performance Anomaly Detection” class (at CMG.com). Worked 2 years as the Capacity team lead for IBM, worked for SunTrust Bank for 3 years and then at IBM for 3 years as Sr. IT Architect. Now he works for Capital One bank as IT Manager at the Cloud Engineering and since 2015 he is a member of CMG.org Board of Directors. Runs UT channel iTrubin
Monday, September 17, 2012
LinkedIn Discussion around Trubin's Availability Formula
The previous post "Cluster Availability 9's Equation" triggered a very good discussion on LinkedIn Continuous Availability Forum. It currently has 19 comments (!)... I plan to re-post some comments from the discussion here in my blog. (UPDATE: it is re-posted here)BTW in one of the comments Bill Highleyman (co-author of the Breaking the Availability Barrier) pointed on the mistake in my formula which I corrected by replacing "n+n" with "mn". He also provided the excellent resource about availability calculation where he writes articles at the The Geek Corner for Availability Digest. One of the articles there extends the subject of this ( and couple previous) post and called: "Calculating Availability – Redundant Systems "
As I suspected my formula ("Trubin law") is just a particular case of more generic rule Bill Highleyman formulates in that article. That says:
"... Adding a spare node adds the number of nines associated with that node to the system
availability but reduced by the increase in failure modes.
That is, adding an additional spare node adds the number of 9s of that node to the system
availability – almost. This improvement in availability is reduced a bit by the increase in the
number of failure modes in the system. More nodes mean more failure modes..."
He started in 1979 as IBM/370 system engineer. In 1986 he got his PhD. in Robotics at St. Petersburg Technical University (Russia) and then worked as a professor teaching CAD/CAM, Robotics for 12 years. He published 30+ papers and made several presentations for conferences related to the Robotics and Artificial Intelligent fields. In 1999 he moved to the US, worked at Capital One bank as a Capacity Planner. His first CMG.org paper was written and presented in 2001. The next one, "Exception Detection System Based on MASF Technique," won a Best Paper award at CMG'02 and was presented at UKCMG'03 in Oxford, England. He made other tech. presentations at IBM z/Series Expo, SPEC.org, Southern and Central Europe CMG and ran several workshops covering his original method of Anomaly and Change Point Detection (Perfomalist.com). Author of “Performance Anomaly Detection” class (at CMG.com). Worked 2 years as the Capacity team lead for IBM, worked for SunTrust Bank for 3 years and then at IBM for 3 years as Sr. IT Architect. Now he works for Capital One bank as IT Manager at the Cloud Engineering and since 2015 he is a member of CMG.org Board of Directors. Runs UT channel iTrubin
Friday, September 14, 2012
Cluster Availability 9's Equation

But how that would work for other single node availability numbers? What if that has two or three 9's? I have generalized my previous equation to cover that and it shows that the cluster availability number of 9's will be increasing in arithmetic progression (sequence)!
He started in 1979 as IBM/370 system engineer. In 1986 he got his PhD. in Robotics at St. Petersburg Technical University (Russia) and then worked as a professor teaching CAD/CAM, Robotics for 12 years. He published 30+ papers and made several presentations for conferences related to the Robotics and Artificial Intelligent fields. In 1999 he moved to the US, worked at Capital One bank as a Capacity Planner. His first CMG.org paper was written and presented in 2001. The next one, "Exception Detection System Based on MASF Technique," won a Best Paper award at CMG'02 and was presented at UKCMG'03 in Oxford, England. He made other tech. presentations at IBM z/Series Expo, SPEC.org, Southern and Central Europe CMG and ran several workshops covering his original method of Anomaly and Change Point Detection (Perfomalist.com). Author of “Performance Anomaly Detection” class (at CMG.com). Worked 2 years as the Capacity team lead for IBM, worked for SunTrust Bank for 3 years and then at IBM for 3 years as Sr. IT Architect. Now he works for Capital One bank as IT Manager at the Cloud Engineering and since 2015 he is a member of CMG.org Board of Directors. Runs UT channel iTrubin
Wednesday, September 12, 2012
The Right Number of Cluster Redundancy to Achieve the Availability Goal. Trubin's Law #4!
...Still playing with the availability algebra exercise, that I started in my other post: How to Calculate Availability of Clustered Infrastructure for Multi-Tier Application
I have built the following two charts to see how the same availability goal can be achieved by different number of redundancy.

That of course possible if the less redundant configuration has more available individual components.

That of course possible if the less redundant configuration has more available individual components.
By the way, interesting that if the component availability has one 9's (90.00%), then increasing redundancy on +1 gives the additional one 9's for the cluster availability.
So, the equation
has the following solution: A=0.9 for any integer n within the interval (0,∞)
It is probably the known law in the availability algebra. If not let's call that Trubin's law #4! ;)
________
This Saga of 9's continuous in the next post:
________
This Saga of 9's continuous in the next post:
Cluster Availability 9's Equation
He started in 1979 as IBM/370 system engineer. In 1986 he got his PhD. in Robotics at St. Petersburg Technical University (Russia) and then worked as a professor teaching CAD/CAM, Robotics for 12 years. He published 30+ papers and made several presentations for conferences related to the Robotics and Artificial Intelligent fields. In 1999 he moved to the US, worked at Capital One bank as a Capacity Planner. His first CMG.org paper was written and presented in 2001. The next one, "Exception Detection System Based on MASF Technique," won a Best Paper award at CMG'02 and was presented at UKCMG'03 in Oxford, England. He made other tech. presentations at IBM z/Series Expo, SPEC.org, Southern and Central Europe CMG and ran several workshops covering his original method of Anomaly and Change Point Detection (Perfomalist.com). Author of “Performance Anomaly Detection” class (at CMG.com). Worked 2 years as the Capacity team lead for IBM, worked for SunTrust Bank for 3 years and then at IBM for 3 years as Sr. IT Architect. Now he works for Capital One bank as IT Manager at the Cloud Engineering and since 2015 he is a member of CMG.org Board of Directors. Runs UT channel iTrubin
Friday, September 7, 2012
EV Based Trend Display - Trubin's Criterion!
Very typical task is to display trend direction on a dashboard type of report. Here is an example from SAS website:


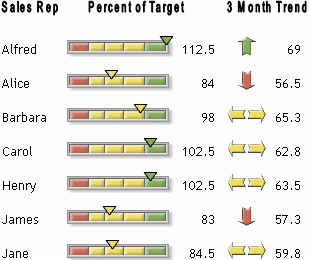
But how correctly to choose the direction? Based on
what? My suggestion is to
use Exception Value (EV) meta metric (Check how that should
be calculated here: EV-Control Chart). Indeed, for the given
most recent time period (e.g. day, week or month) EV will be greater than 0 , if more
UCL crossings happened than LCL crossings; EV
will be 0 if everything occurred within
UCL-LCL band; and EV will be less than 0, if more LCL crossings happened than UCL crossings.
That criterion have been already used to detect most recent trends, but the same
way that could be used to choose the right direction for the trend arrow on
dashboards!
So the
Trubin's Criterion would be:
He started in 1979 as IBM/370 system engineer. In 1986 he got his PhD. in Robotics at St. Petersburg Technical University (Russia) and then worked as a professor teaching CAD/CAM, Robotics for 12 years. He published 30+ papers and made several presentations for conferences related to the Robotics and Artificial Intelligent fields. In 1999 he moved to the US, worked at Capital One bank as a Capacity Planner. His first CMG.org paper was written and presented in 2001. The next one, "Exception Detection System Based on MASF Technique," won a Best Paper award at CMG'02 and was presented at UKCMG'03 in Oxford, England. He made other tech. presentations at IBM z/Series Expo, SPEC.org, Southern and Central Europe CMG and ran several workshops covering his original method of Anomaly and Change Point Detection (Perfomalist.com). Author of “Performance Anomaly Detection” class (at CMG.com). Worked 2 years as the Capacity team lead for IBM, worked for SunTrust Bank for 3 years and then at IBM for 3 years as Sr. IT Architect. Now he works for Capital One bank as IT Manager at the Cloud Engineering and since 2015 he is a member of CMG.org Board of Directors. Runs UT channel iTrubin
Friday, August 31, 2012
Z Capacity Management without SAS and MXG
I have just commented the following post on LinkedIn:
"Is there anyone using anything else besides SAS or SAS assisted tools for analyzing Z/OS SMF data? If so, what are you using?"
I have involved in some IBM activity to offer an alternative (to SAS) solution to process and analyze SMF data by using TDS + SPSS + COGNOS (all IBM tools).
My part of this is to offer SETDS elements to include in the out-of-box COGNOS (and potentially SPSS) reporting, such as IT Control Charts, EV based anomaly and recent trend detection.
He started in 1979 as IBM/370 system engineer. In 1986 he got his PhD. in Robotics at St. Petersburg Technical University (Russia) and then worked as a professor teaching CAD/CAM, Robotics for 12 years. He published 30+ papers and made several presentations for conferences related to the Robotics and Artificial Intelligent fields. In 1999 he moved to the US, worked at Capital One bank as a Capacity Planner. His first CMG.org paper was written and presented in 2001. The next one, "Exception Detection System Based on MASF Technique," won a Best Paper award at CMG'02 and was presented at UKCMG'03 in Oxford, England. He made other tech. presentations at IBM z/Series Expo, SPEC.org, Southern and Central Europe CMG and ran several workshops covering his original method of Anomaly and Change Point Detection (Perfomalist.com). Author of “Performance Anomaly Detection” class (at CMG.com). Worked 2 years as the Capacity team lead for IBM, worked for SunTrust Bank for 3 years and then at IBM for 3 years as Sr. IT Architect. Now he works for Capital One bank as IT Manager at the Cloud Engineering and since 2015 he is a member of CMG.org Board of Directors. Runs UT channel iTrubin
Friday, August 17, 2012
How to Calculate Availability of Clustered Infrastructure for Multi-Tier Application
That is the task I am working on right now. I have some progress and the approach I found is to build availability graph to consider the clustered infrastructure as a chain of parallel and sires connected nodes described here with formulas. So below is a simple example:

And the availability calculation formula will be:
A = A1*(1-(1-(A2*A3)n)*A4
You can play with different level of redundancy "n" of the cluster here. Currently it is 2 but you could estimate it for n=3 or n=4. That approach opens possibility to quantitatively justify you architectural decisions (not just using "best practices" or "gut feelings").
If you know MTTR for each individual component (SW and HW) you could estimate the whole infrastructure availability using this approach. But how to get that individual MTTR? From vendors - good luck! Maybe from incident records? Or set up special monitoring for that (Synthetic- robotic?)
Other useful resources with formulas that relevant to this:
BOOK
One more book: Breaking the Availability Barrier
_______________
BTW This "Saga of 9's" continuous in the next posts:
LinkedIn Discussion around Trubin's Availability Formula
The Right Number of Cluster Redundancy to Achieve the Availability Goal. Trubin's Law #4!
Cluster Availability 9's Equation
One more book: Breaking the Availability Barrier
_______________
BTW This "Saga of 9's" continuous in the next posts:
LinkedIn Discussion around Trubin's Availability Formula
The Right Number of Cluster Redundancy to Achieve the Availability Goal. Trubin's Law #4!
Cluster Availability 9's Equation
He started in 1979 as IBM/370 system engineer. In 1986 he got his PhD. in Robotics at St. Petersburg Technical University (Russia) and then worked as a professor teaching CAD/CAM, Robotics for 12 years. He published 30+ papers and made several presentations for conferences related to the Robotics and Artificial Intelligent fields. In 1999 he moved to the US, worked at Capital One bank as a Capacity Planner. His first CMG.org paper was written and presented in 2001. The next one, "Exception Detection System Based on MASF Technique," won a Best Paper award at CMG'02 and was presented at UKCMG'03 in Oxford, England. He made other tech. presentations at IBM z/Series Expo, SPEC.org, Southern and Central Europe CMG and ran several workshops covering his original method of Anomaly and Change Point Detection (Perfomalist.com). Author of “Performance Anomaly Detection” class (at CMG.com). Worked 2 years as the Capacity team lead for IBM, worked for SunTrust Bank for 3 years and then at IBM for 3 years as Sr. IT Architect. Now he works for Capital One bank as IT Manager at the Cloud Engineering and since 2015 he is a member of CMG.org Board of Directors. Runs UT channel iTrubin
Thursday, August 2, 2012
SEDS-Lite: Using Open Source Tools (R, BIRT, MySQL) to Report and Analyze Performance Data - my new CMG'12 paper
20202 UPDATE: The SEDS-Lite web app is about to be released!
_________________________________________________________
I wrote this paper with some help from Shadi G. (from Dublin, also IBMer).
The paper is based on my blog postings:
SEDS-Lite Presentation at Southern CMG Meeting in the SAS Institute
SEDS-Lite Introduction
How To Build IT-Control Chart - Use the Excel Pivot Table!
BIRT based Control Chart
HERE IS THE VIDEO PRESENTATION
Below is the abstract:
Statistical Exception Detection (SEDS) is one of the variations of learning behavior based performance analysis methodology developed, implemented and published by Author. This paper took main SEDS tools – IT-Control Chart and Exceptions (Anomalies) Detector - and showed how that could be built by Open Source type of BI tools, such as R, BIRT and MySQL or just by spreadsheet. The paper includes source codes, tool screen-shots and report input/output examples to allow reader building/developing a light version of SEDS.
-------------------------
The presentation of this paper is scheduled on December 5th, 2012 Wednesday, 2:45:00 PM - 3:45:00 PM in Las Vegas, Nevada
-------------------------
THAT IS MY SECOND CMG'12 PAPER. THE FIRST ONE ANNOUNCED HERE:
AIX frame and LPAR level Capacity Planning. User Case for Online Banking Application
He started in 1979 as IBM/370 system engineer. In 1986 he got his PhD. in Robotics at St. Petersburg Technical University (Russia) and then worked as a professor teaching CAD/CAM, Robotics for 12 years. He published 30+ papers and made several presentations for conferences related to the Robotics and Artificial Intelligent fields. In 1999 he moved to the US, worked at Capital One bank as a Capacity Planner. His first CMG.org paper was written and presented in 2001. The next one, "Exception Detection System Based on MASF Technique," won a Best Paper award at CMG'02 and was presented at UKCMG'03 in Oxford, England. He made other tech. presentations at IBM z/Series Expo, SPEC.org, Southern and Central Europe CMG and ran several workshops covering his original method of Anomaly and Change Point Detection (Perfomalist.com). Author of “Performance Anomaly Detection” class (at CMG.com). Worked 2 years as the Capacity team lead for IBM, worked for SunTrust Bank for 3 years and then at IBM for 3 years as Sr. IT Architect. Now he works for Capital One bank as IT Manager at the Cloud Engineering and since 2015 he is a member of CMG.org Board of Directors. Runs UT channel iTrubin
Tuesday, July 31, 2012
AIX frame and LPAR level Capacity Planning. User Case for Online Banking Application - my new CMG'12 paper
- UPDATE: This paper was re-presented in SCMG and presentation slides are available: http://itrubin.blogspot.com/2013/04/aix-frame-and-lpar-level-capacity.html
- I have just got acceptance notifications about my two new CMG papers I wrote and submitted for this year CMG'12 conference.
- Both abstracts are published here CMG'12 Abstract Report.
- Below is the abstract of the 1st one which is base on the successful project I had this year.
- AIX frame and LPAR level Capacity Planning. User Case for Online Banking Application.
The paper shares some challenges the Online Banking Capacity Management team had and overcame during the Solaris to AIX migration. The raw capacity estimation model was built to estimate AIX frames capacity needs. The Capacity planning process was adjusted to virtualized environment. The essential system, middleware and database metrics to monitor capacity were identified; business driver correlated forecast reports were built to proactively tune entitlements; IT-Control Charts were created to establish dynamic thresholds for Ph. Processors and IOs usage. Capacity Council was established.
The presentation of this paper is scheduled on December 5th, 2012 Wednesday, 9:15:00 AM - 10:15:00 AM in Las Vegas, Nevada (check updates here: http://www.cmg.org/conference/cmg2012/ )
_____________________________________
The 2nd paper information is on the next post:
SEDS-Lite: Using Open Source Tools (R, BIRT, MySQL) to Report and Analyze Performance Data
_____________________________________
The 2nd paper information is on the next post:
SEDS-Lite: Using Open Source Tools (R, BIRT, MySQL) to Report and Analyze Performance Data
He started in 1979 as IBM/370 system engineer. In 1986 he got his PhD. in Robotics at St. Petersburg Technical University (Russia) and then worked as a professor teaching CAD/CAM, Robotics for 12 years. He published 30+ papers and made several presentations for conferences related to the Robotics and Artificial Intelligent fields. In 1999 he moved to the US, worked at Capital One bank as a Capacity Planner. His first CMG.org paper was written and presented in 2001. The next one, "Exception Detection System Based on MASF Technique," won a Best Paper award at CMG'02 and was presented at UKCMG'03 in Oxford, England. He made other tech. presentations at IBM z/Series Expo, SPEC.org, Southern and Central Europe CMG and ran several workshops covering his original method of Anomaly and Change Point Detection (Perfomalist.com). Author of “Performance Anomaly Detection” class (at CMG.com). Worked 2 years as the Capacity team lead for IBM, worked for SunTrust Bank for 3 years and then at IBM for 3 years as Sr. IT Architect. Now he works for Capital One bank as IT Manager at the Cloud Engineering and since 2015 he is a member of CMG.org Board of Directors. Runs UT channel iTrubin
Thursday, July 12, 2012
Just submitted CMG'12 papers abstracts: Very preliminary analysis
Abstracts are published anonymously here: http://www.cmg.org/cgi-bin/abstract_view.pl
Apparently one of the papers was inspired by me:
Time-Series: Forecasting + Regression: “And” or “Or”?
At CMG’11, I had a fascinating discussion with Dr. I.Trubin. We talked about Uncertainty, Second Law of Thermodynamics, and other high matters in relation to IT. That discussion prompted this paper. We propose a method to get better predictions when we have a forecast of independent variable and a regression. It works for any scenarios where performance can be linked with business metrics. A real-world example is worked through that demonstrates how this technique works to improve the performance metric prediction and highlight trends that would have been overlooked otherwise.
I guess that relates to my other posting about other paper that use "entropy" :
Quantifying Imbalance in Computer Systems: CMG'11 Trip Report, Part 2
Quantifying Imbalance in Computer Systems: CMG'11 Trip Report, Part 2
The following are abstracts of some other papers from the list that potentially could relate to the main topics of this blog. I cannot wait when I can read them!
Methods for Identifying Anomalous Server Behavior
Identifying anomalous server behavior in large server farms is often overlooked for a variety of reasons. The anomalous behavior does not breach alerting thresholds, or perhaps the behavior is subtle and is simply missed. Whatever the case, it is important to identify such behavior before it becomes more severe. In this paper we discuss methods of identifying server behavior that is anomalous or otherwise or uncharacteristic. Methods include statistical techniques such as multidimensional scaling, and machine learning methods such as isolation forests and self organizing maps.
Software Performance Antipatterns
for Identifying and Correcting Performance Problems
Performance antipatterns document common software performance problems as well as their solutions. These problems are often introduced during the architectural or design phases of software development, but not detected until later in testing or deployment. Solutions usually require software changes as opposed to system tuning changes. This tutorial covers five performance antipatterns and gives examples to illustrate them. These antipatterns will help developers and performance engineers avoid common performance problems.
Introduction to Wavelets and their Application for Computer Performance Trend and Anomaly Detection
In this paper I will present a technique to identify trends and anomalies in Performance data using wavelets. I will answer the following questions: Why use Wavelets? What are Wavelets? How do I use them?
Application Invariants: Finding constants amidst all the change
This paper presents a method for deriving and utilizing Application Invariants. An Application Invariant is a metric that quantifies the behavior or performance of an application in such a way that its value is immune to changes in workload volume. Several sample Application Invariants are developed and presented. One of the primary benefits of an Application Invariant is that it provides a simple (flat) shape that can readily be used to track changes in application performance or behavior in an automated manner.
Couple other papers could be found there with the obvious interest for this blog.... Will post them later here.
All in all, based on the 1st glance, looks like this year CMG conference (http://www.cmg.org/ ) will have a great success.
He started in 1979 as IBM/370 system engineer. In 1986 he got his PhD. in Robotics at St. Petersburg Technical University (Russia) and then worked as a professor teaching CAD/CAM, Robotics for 12 years. He published 30+ papers and made several presentations for conferences related to the Robotics and Artificial Intelligent fields. In 1999 he moved to the US, worked at Capital One bank as a Capacity Planner. His first CMG.org paper was written and presented in 2001. The next one, "Exception Detection System Based on MASF Technique," won a Best Paper award at CMG'02 and was presented at UKCMG'03 in Oxford, England. He made other tech. presentations at IBM z/Series Expo, SPEC.org, Southern and Central Europe CMG and ran several workshops covering his original method of Anomaly and Change Point Detection (Perfomalist.com). Author of “Performance Anomaly Detection” class (at CMG.com). Worked 2 years as the Capacity team lead for IBM, worked for SunTrust Bank for 3 years and then at IBM for 3 years as Sr. IT Architect. Now he works for Capital One bank as IT Manager at the Cloud Engineering and since 2015 he is a member of CMG.org Board of Directors. Runs UT channel iTrubin
Subscribe to:
Posts (Atom)